Environment: gpt-image-1 via the OpenAI images API, 1536×1024, quality: high; Playwright 1.62, headless Chromium, deviceScaleFactor: 2. The diagrams in this series, including the last post’s delay chart, are built this way.
A few weeks ago I wrote about drawing a hundred figures for a grammar book: one character per call, no text in the image, speech and arrows composed afterwards in HTML. That rule was about the page.
This post is the same rule applied to the blog. Every article in this run has two pictures. They do not come from the same program, and they must not.
The last one needed a chart with 5 minutes, 50 minutes, and 115 minutes on it. Those numbers are the finding. If they are wrong, or unreadable, or almost-the-right-glyphs, the post is wrong. An image model does not set type. A browser does.
Two files, two jobs
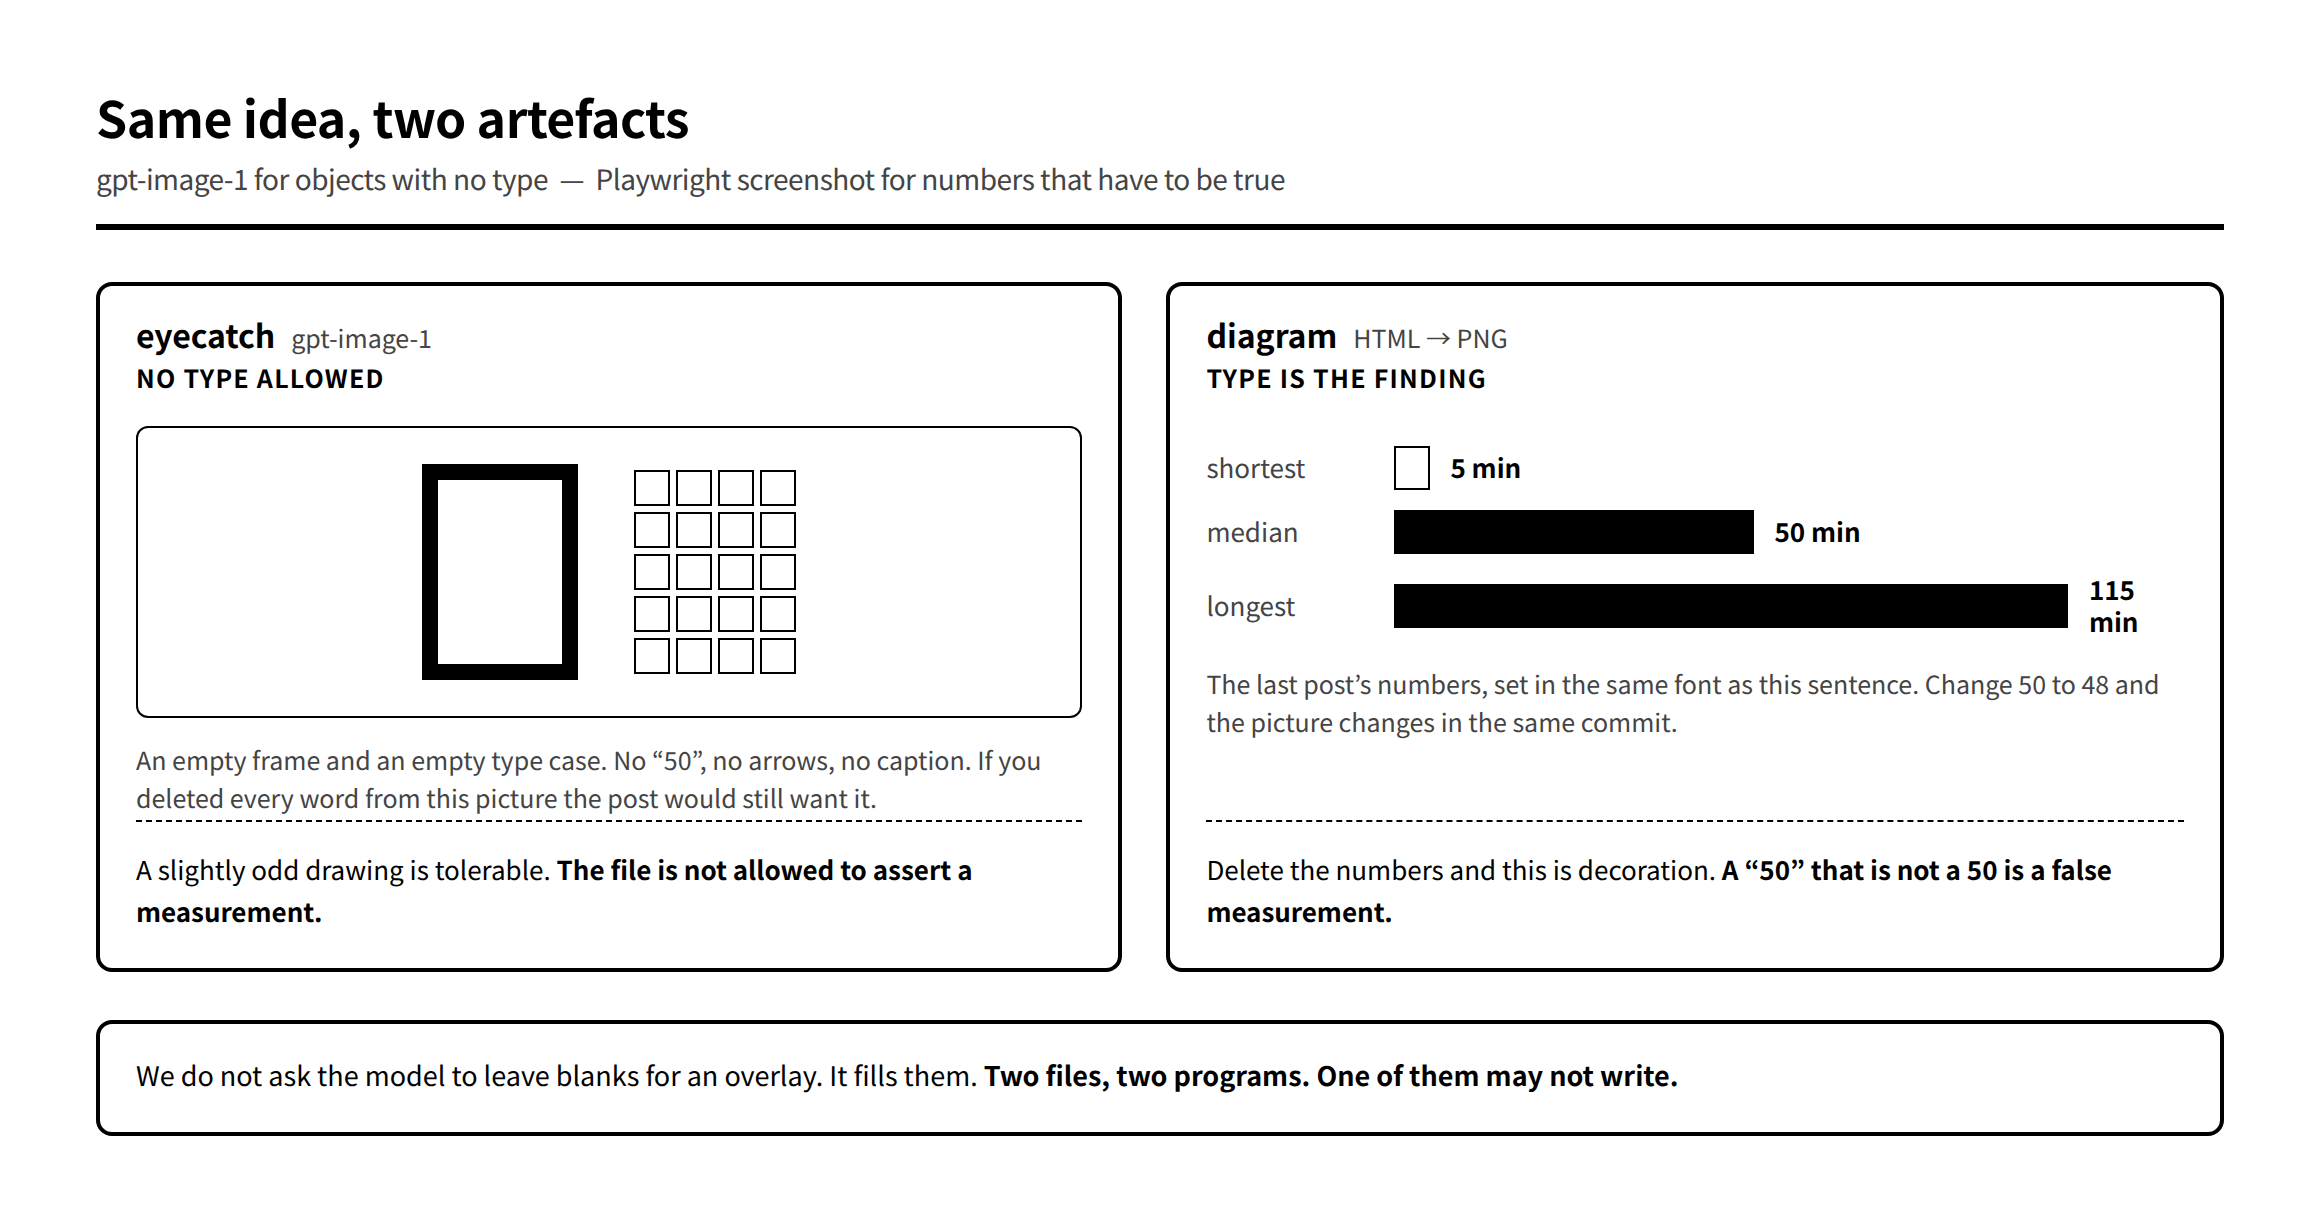
The eyecatch is a black line drawing on white. It is there so the index page has a picture, and so the series looks like one series. It is generated with gpt-image-1. The prompt is a subject line plus a style block that does not change from post to post.
The diagram is the argument in a picture: a pipeline, a table, a measured range. It is an HTML file, opened in Chromium, screenshotted at 2×. The type is a real font. The numbers are characters in the file, the same characters as in the prose.
The split is not aesthetic. It is about which failures we can live with.
A slightly odd hourglass on an eyecatch is fine. A "50" that is not a 50, on the chart that claims a median of 50 minutes, is not a style problem. It is a false measurement.
Advertisement
Why the model does not get the labels
Ask an image model to draw a labelled diagram and it will produce something that looks like a labelled diagram. The letters are letter-shaped. The digits are digit-shaped. On a skim they pass. On a zoom they are not the string you sent, and they are not quite the same string twice.
Japanese is the obvious disaster — plausible strokes that are not characters, which we already refuse to put in a textbook figure. English and numerals fail more quietly. A "115" that has become a "11S", or a "50 min" whose "min" is three marks that only work at thumbnail size, is worse than a missing label, because it still looks like evidence.
So the style string for every eyecatch in this series forbids the thing the diagram exists to carry:
const STYLE = [
  'Black ink line drawing only. Pure line art, no color, no gray fill, no shading,',
  'no hatching, no gradient, no dot screen. Uniform medium stroke weight, clean confident lines.',
  'Plain flat white background, nothing behind the objects, no border, no frame.',
  'Absolutely no text, no letters, no numbers, no words, no logos, no symbols, no arrows anywhere in the image.',
  'Book pages and screens must be blank or show only plain horizontal ruled lines — never letters.',
  // …
].join(' ');
Arrows are banned too, for the same reason labels are. An arrow is a claim about flow. If the model invents a second arrow, or points it the wrong way, the eyecatch starts arguing. The eyecatch is not allowed to argue. It is a picture of objects.
The temptation, when one eyecatch comes back a bit empty, is to let "a small caption" into that one prompt. Don’t. The style block is shared so that twelve posts look like twelve posts. Rewriting it for a single image describes a different pen. Change the subject line, or reroll.
Why the diagram is a screenshot, not a PDF
The diagram file is ordinary HTML: a 1160-pixel-wide page, black borders, one webfont, no colour. Playwright opens it and takes a PNG.
const page = await browser.newPage({
  viewport: { width: 1160, height: 900 },
  deviceScaleFactor: 2,
});
await page.goto(fileUrl, { waitUntil: 'networkidle' });
const box = await page.evaluate(() => {
  const b = document.body.getBoundingClientRect();
  return { w: Math.ceil(b.width), h: Math.ceil(b.height) };
});
await page.setViewportSize({ width: box.w, height: box.h });
await page.screenshot({ path: out, fullPage: true });
Two details earn their keep.
deviceScaleFactor: 2. The file is displayed on the site at roughly half that width. Type that is painted at 1× and then scaled down goes muddy. Type that is painted at 2× and displayed smaller stays a stroke. This is the same reason a print cover is not authored at screen resolution.
screenshot, not page.pdf(). We already know that Playwright’s PDF path treats CSS pixels as 1/96 inch and will happily emit a page whose content does not fit the sheet. A PNG does not have a second unit system. What you see in the browser is, byte for byte, what you upload. For a diagram that is the whole point: there is no preview path distinct from the delivery path.
The HTML is the source. If the median changes from 50 to 48, the diagram changes in the same commit as the sentence. There is no "redraw the chart" step, and no opportunity for the picture and the prose to disagree.
What belongs in which file
A useful test: if you deleted every word from the picture, would the post still need it?
- Hourglass and camera, no labels → eyecatch. It says "this post is about time and film" without asserting a number.
- A bar labelled 50 minutes next to a bar labelled 115 → diagram. Delete the numbers and it is decoration.
Pipelines, state machines, before/after layouts, anything with a count or a unit goes in HTML. Objects, gestures, empty trays, a box with a hatch go to the model.
We do not ask the model to "draw a diagram with the numbers left blank so we can overlay them". It will put marks in the blanks anyway, and the overlay will fight them. Two files. Two programs. One of them may not write.
The series depends on this being boring
The eyecatch style is identical across the run so that a reader scrolling the index is not asked to admire twelve different pens. The diagram style is identical — same page width, same border weight, same typeface — so that a chart in post 13 is readable in the same way as a chart in post 5.
That only holds if neither file is a special case. The model is not asked to letter. The browser is not asked to invent a picture. The last post’s delay chart and this post’s split are the same tool. The finding changes. The typesetting does not.
The next post in this series is not scheduled yet.