Creating progress management graphs with Django + Chart.js
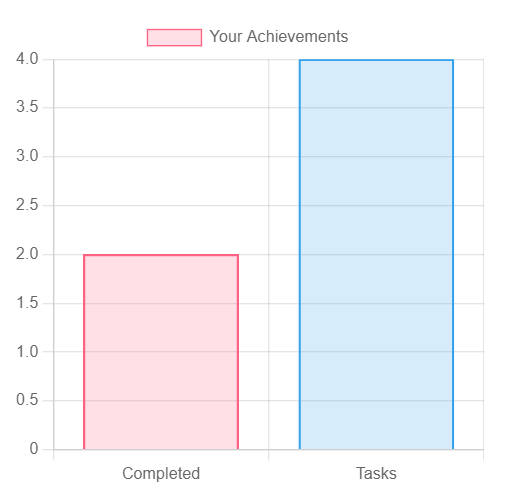
Chart.js Implementation of Lesson Progress Chart
Blue is the number of lessons (tasks) and pink is the number completed.
Defines lesson (task) completion in the Lesson model: BooleanField.
Chart.js to display the number of “completed”.
from django.conf import settings           # settings.pyに追記しておく:AUTH_USER_MODEL = 'students.User'
from django.contrib.auth.models import AbstractUser

class User(AbstractUser):
    pass

class Lesson(models.Model):
    student = models.ForeignKey(User, on_delete=models.PROTECT) #ForeignKeyでstudentを紐づける

"""中略"""

    completed = models.BooleanField(default=False) # default=False で初期値を未完了に設定

"""中略"""
class Lesson(models.Model):
ForeignKey(User, on_delete=models.PROTECT), the student is tied by ForeignKey.
Count the number of “tasks” and “completed” by student: count()
from django.db.models import Count # Countをインポートしておく

def myChart(request):
    """Summary of Achievement"""
    current_user = request.user # ログイン中のユーザーを取得
    queryset = Lesson.objects.filter(student=current_user.id) # 該当ユーザーに紐づいたレッスンを取得
    tasks = queryset.count() # レッスン数をカウント
    completed = Lesson.objects.filter(student=current_user.id, completed=True).count()
                # レッスン内の「completed(完了)」をカウント

"""中略"""

    return render(request, 'students/mychart.html', {
        'tasks': tasks,
        'completed': completed,

"""中略"""
    })
from django.db.models import Count # Import Count
current_user = request.user # Get the user who is currently logged in
queryset = Lesson.objects.filter(student=current_user.id) # Get the lesson associated with the user
tasks = queryset.count() # count the number of lessons
completed = Lesson.objects.filter(student=current_user.id, completed=True).count()
# Count “completed” in the lesson
Since chart.js CDN is used, describe it in base.html
{% load static %}

<!DOCTYPE html>
<html lang="ja">

<head>
    <!-- Required Meta Tags -->
    <meta charset="UTF-8">
    <meta name="viewport" content="width=device-width, initial-scale=1, shrink-to-fit=no">

"""中略"""
    <script src="https://cdn.jsdelivr.net/npm/chart.js@3.5.0/dist/chart.min.js"></script>
</head>

<body>

"""中略"""

    <div class="body">
        {% block body %}
        {% endblock %}
    </div>

    <script src="https://ajax.googleapis.com/ajax/libs/jquery/3.6.0/jquery.min.js"></script>
    <script src="https://cdnjs.cloudflare.com/ajax/libs/popper.js/1.14.3/umd/popper.min.js" integrity="sha384-ZMP7rVo3mIykV+2+9J3UJ46jBk0WLaUAdn689aCwoqbBJiSnjAK/l8WvCWPIPm49" crossorigin="anonymous"></script>
    <script src="https://stackpath.bootstrapcdn.com/bootstrap/4.1.3/js/bootstrap.min.js" integrity="sha384-ChfqqxuZUCnJSK3+MXmPNIyE6ZbWh2IMqE241rYiqJxyMiZ6OW/JmZQ5stwEULTy" crossorigin="anonymous"></script>
    {% block jquery %}{% endblock %}
</body>

</html>
Layout & chart.js settings in mychart.html
Copy and paste the chart.js sample code and edit it
{% extends "students/base.html" %}

{% block title %} My Chart {% endblock %}

{% block jquery %}
<script>

"""chart.js のサンプルコードをコピペして編集"""

$(document).ready(function(){
var ctx = document.getElementById('myChart').getContext('2d');
var myChart = new Chart(ctx, {
    type: 'bar',
    data: {
        labels: ['Completed', 'Tasks'], # ラベル名を記述
        datasets: [{
            label: 'Your Achievements', # タイトルを記述
            data: [{{ completed | safe }}, {{ tasks | safe }}], # views.pyで定義したデータ取得
            backgroundColor: [
                'rgba(255, 99, 132, 0.2)',
                'rgba(54, 162, 235, 0.2)', # 今回は2本のグラフなので、余分な色を削除
            ],
            borderColor: [
                'rgba(255, 99, 132, 1)',
                'rgba(54, 162, 235, 1)', # 今回は2本のグラフなので、余分な色を削除
            ],
            borderWidth: 1
        }]
    },
    options: {
        scales: {
            y: {
                beginAtZero: true,
                stepSize: 1
            }
        }
    }
});

})
</script>
{% endblock %}

{% load static %}
{% block body %}

<div class="container">
    <div class='row'>
        <div class='col-sm-4'>
            <div class="card">
"""中略"""
            </div>
        </div>
        <div class='col-sm-4'>
            <canvas id="myChart" width="400" height="400"></canvas> # ここにグラフを表示
        </div>
        <div class='col-sm-4'>
            <div class="card">
"""中略"""
            </div>
        </div>
    </div>
</div>
{% endblock %}
<div class='col-sm-4'>
<canvas id="myChart" width="400" height="400"></canvas> # Show graph here
</div>Complete
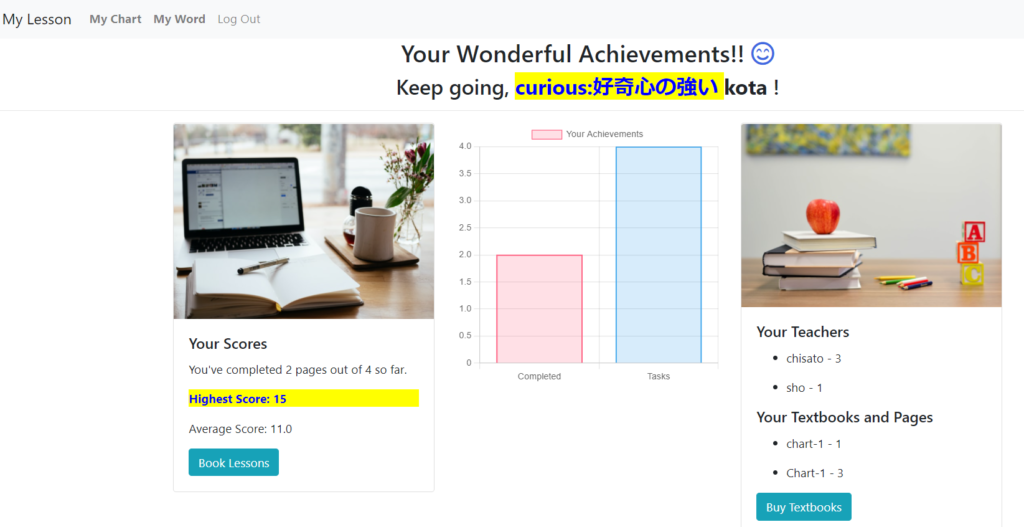
Summary of this topic
Reference: Django with Chart js | How to create charts with Django and Chart js
Reference: Django + Chart.js // Learn to intergrate Chart.js with Django
Reference: Django + Chart Js | How To Create Charts With Django and Chart Js

コメント